Debugging
When working with ComponentKit, you would generally uses generic views such as UIButton, UIImageView, etc. under the hood. Hence, when you run a command in the LLDB debugger like Chisel's pviews you'll see a generic view hierarchy with no information about components. The following is the output of running pviews for an application using ComponentKit.
| <UICollectionView: 0x7caf3800; frame = (0 0; 320 568); clipsToBounds = YES; autoresize = W+H; gestureRecognizers = <NSArray: 0x7b462e50>; layer = <CALayer: 0x7b462a80>; contentOffset: {0, 315}; contentSize: {320, 5951}> collection view layout: <UICollectionViewFlowLayout: 0x7ae60ab0>| | <UICollectionViewCell: 0x7b1b9e00; frame = (0 0; 320 496.5); layer = <CALayer: 0x7b1b9fa0>>| | | <UIView: 0x7b1ba150; frame = (0 0; 320 496.5); gestureRecognizers = <NSArray: 0x7b06f360>; layer = <CALayer: 0x7b1ba1c0>>| | | | <UIView: 0x7b1ba8d0; frame = (0 0; 320 496.5); gestureRecognizers = <NSArray: 0x7b1baed0>; layer = <CALayer: 0x7b1ba940>>| | | | | <UIImageView: 0x7b1bb220; frame = (0 0; 320 496); clipsToBounds = YES; opaque = NO; userInteractionEnabled = NO; layer = <CALayer: 0x7b1bb2a0>>| | | | | <CKTextComponentView: 0x7ae61820; baseClass = UIControl; frame = (20.5 70; 278.5 240.5); userInteractionEnabled = NO; layer = <CKTextComponentLayer: 0x7ae61da0>>| | | | | <CKTextComponentView: 0x7ae71820; baseClass = UIControl; frame = (230.5 310.5; 64.5 160.5); userInteractionEnabled = NO; layer = <CKTextComponentLayer: 0x7ae640f0>>| | | | | <UIView: 0x7ae72670; frame = (0 496; 320 0.5); layer = <CALayer: 0x7ae726e0>>...................................| | <UICollectionViewCell: 0x7b1b6040; frame = (0 852; 320 416.5); layer = <CALayer: 0x7b1a8990>>| | | <UIView: 0x7b1b0600; frame = (0 0; 320 416.5); gestureRecognizers = <NSArray: 0x7b1ac610>; layer = <CALayer: 0x7b1b93f0>>| | | | <UIView: 0x7b1a6530; frame = (0 0; 320 416.5); gestureRecognizers = <NSArray: 0x7b1aa1d0>; layer = <CALayer: 0x7b1a65a0>>| | | | | <UIImageView: 0x7b1b6cf0; frame = (0 0; 320 416); clipsToBounds = YES; opaque = NO; userInteractionEnabled = NO; layer = <CALayer: 0x7b1b6d70>>| | | | | <CKTextComponentView: 0x7b1b86c0; baseClass = UIControl; frame = (30 133; 260 150.5); userInteractionEnabled = NO; layer = <CKTextComponentLayer: 0x7b1b8750>>| | | | | <UIView: 0x7ae735e0; frame = (0 416; 320 0.5); layer = <CALayer: 0x7ae74cd0>>| | <UIImageView: 0x7b4665f0; frame = (313 565.5; 7 2.5); alpha = 0; opaque = NO; autoresize = TM; userInteractionEnabled = NO; layer = <CALayer: 0x7b466900>>| | <UIImageView: 0x7b466e30; frame = (314.5 413.5; 2.5 47); alpha = 0; opaque = NO; autoresize = LM; userInteractionEnabled = NO; layer = <CALayer: 0x7b466eb0>>
ComponentKit includes a set of debugging tools that help you debug component hierarchies and has strong integration with Chisel. Clone the github repo of Chisel and install it to enable the latest commands.
The following functionality is intended for debugging only and is not suitable for use in production.
Print Component Hierarchy
Type the following in the debugger to print the component hierarchy:
(lldb) po [CKComponentHierarchyDebugHelper componentHierarchyDescription]
This includes layout information like position and size. It is designed to be analogous to how pviews works. It is the easiest way to reason about where your layout might have gone wrong while looking at the component rendered on screen.
For View: <UIView: 0x7b249f70; frame = (0 0; 320 355.5); gestureRecognizers = <NSArray: 0x7b544aa0>; layer = <CALayer: 0x7b249fe0>><InteractiveQuoteComponent: 0x7ae6f710>, Position: {0, 0}, Size: {320, 355.5}| <CKFlexboxComponent: 0x7ae6f670>, Position: {0, 0}, Size: {320, 355.5}| | <MonochromeQuoteComponent: 0x7ae6f380>, Position: {0, 0}, Size: {320, 355}| | | <QuoteBackgroundComponent: 0x7ae6f330>, Position: {0, 0}, Size: {320, 355}| | | | <CKBackgroundLayoutComponent: 0x7ae6f2e0>, Position: {0, 0}, Size: {320, 355}| | | | | <CKComponent: 0x7ae6f290>, Position: {0, 0}, Size: {320, 355}| | | | | <CKInsetComponent: 0x7ae6d6c0>, Position: {0, 0}, Size: {320, 355}| | | | | | <CKBackgroundLayoutComponent: 0x7ae6d670>, Position: {0, 40}, Size: {280, 275}| | | | | | | <CKComponent: 0x7ae6d620>, Position: {0, 0}, Size: {280, 275}| | | | | | | <CKFlexboxComponent: 0x7ae6d4b0>, Position: {0, 0}, Size: {280, 275}| | | | | | | | <CKComponent: 0x7ae6b500>, Position: {10, 0}, Size: {20, 40}| | | | | | | | <CKInsetComponent: 0x7ae6d450>, Position: {30, 0}, Size: {250, 275}| | | | | | | | | <CKLabelComponent: 0x7ae6d400>, Position: {20, 50}, Size: {210, 175}| | | | | | | | | | <CKTextComponent: 0x7ae6d380>, Position: {0, 0}, Size: {210, 175}| | <CKComponent: 0x7ae6f5e0>, Position: {0, 355}, Size: {320, 0.5}
Optionally you can use:
(lldb) po [CKComponentHierarchyDebugHelper componentHierarchyDescriptionForView:0x7be52100 searchUpwards:NO]
This method takes in a view from where to begin its search and the search can be upwards as well, as shown in this case, it traverses up to find the first view on which there's a component hierarchy attached. Note that this works by finding the view at which the root component is attached and then printing the view hierarchy from there downwards.
Generally, if you run this helper you will be presented with multiple component hierarchies, one each for each visible cell. To get the component hierarchy for the cell you're interested in, type taplog on the console and click on a view in the cell you're interested in - taplog would give you the memory address of that view, which you can copy. Then you can use the helper method with the search upwards functionality to get the hierarchy for the cell you are interested in.
pcomponents
To make this easier, we have a LLDB command in Chisel called pcomponents, which is a convenient way to print the component hierachy. Utilizing LLDB's prefix matching, you can even shorten that to pco.
Optionally, it can take a view and also search upwards using the -u flag.
(lldb) pco -u <view>
Visually Debug Components
ComponentKit has helpers to set up debug views, which are phantom views for components which usually wouldn't create any view. To enable debug mode:
(lldb) e (void)[CKComponentDebugController setDebugMode:YES]
Looking through the view hierarchy gives a visual manifestation to layout and can be useful for debugging. Executing the pviews command will now give us a set of views which have the suffix View_Debug which denote phantom component views, we gives a sense of the component hierarchy in the view hierarchy itself, since the phantom views generated have their backing components name as their prefix.
To unset, just setDebugMode:NO instead.
dcomponents
Again, we simplify the debug view helper using a LLDB command in Chisel - dcomponents.
To enable debug view mode:
(lldb) dc -s
and to disable:
(lldb) dc -u
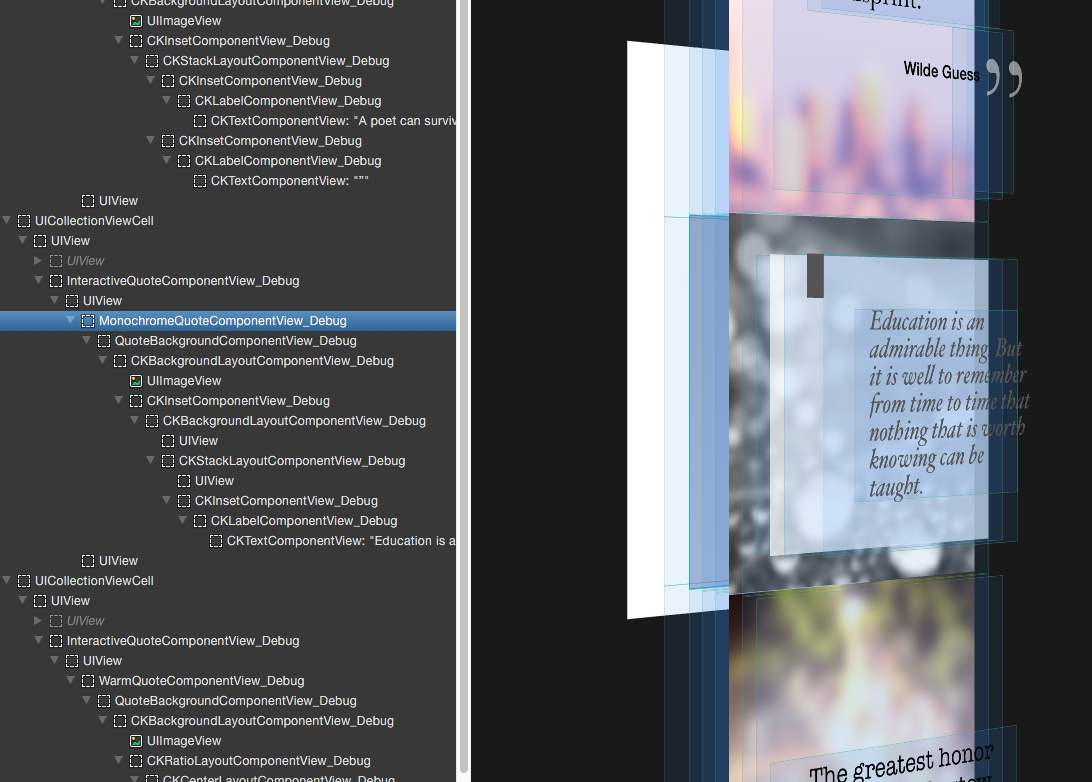
Xcode Debug View Hierachy / Reveal Integration
This helper really shines when you can actually see the view hierarchy, be it in Xcode or Reveal
If you use the the Xcode's default Debug View Hierarchy tool to see the individual views:
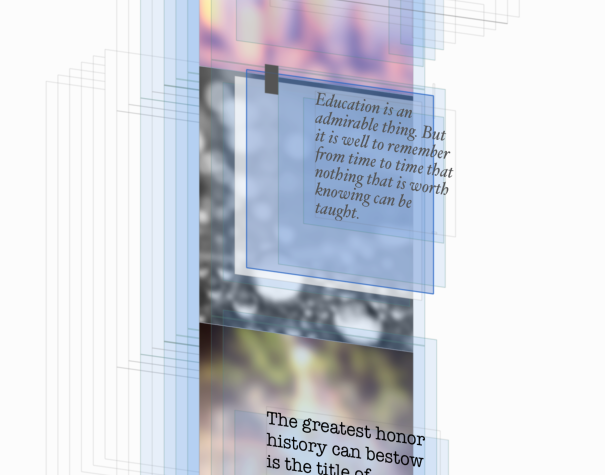
Or you can use Reveal: